Wednesday, February 28, 2007

Status Report for 02/22/07 to 02/28/07

1. Time series analysis graph
To improve interface of the time series analysis portlet, I have been trying to use BHO’s graphic library in a way a user can click a graph to change inputs. However, due to some deficiency in BHO’s graphic library, I need to modify some behavior in the portlet and this requires some changes in data structures in the existing portlet. I haven’t finished yet but will finish soon.

2. Workflow mapping in Grids
As a part of implementation of workflow mapping developed by Yili, I have been making test programs as follows:
a. GPIR client (Completed)
GPIR is a web service as defined in http://gridport.net/services/gpir/webservices.html. It supports two operations: GPIR Query to patch information and GPIR Ingester for updating. By using a query, we can get server information about load, jobs, downtime, queues, queue, and so on. A part of codes as follows:
call.setTargetObjectURI(WS_NAME); // Set a web service API
call.setMethodName(WS_METHOD); // Set method name
Vector params = new Vector();
params.addElement(new Parameter("strQuery", String.class, strQuery, null));
params.addElement(new Parameter("strVO", String.class, strVO, null));
call.setParams(params);
Response resp = call.invoke(url, ""); // Web service invocation
Whole sample code can be found in the same URL above.
b. Network Weather Service (Not yet. A few bugs need to be cleared out)
This is also a web service which provides forecasting service to predict on performance considering network conditions and resources. A sample code can be found in http://nws.cs.ucsb.edu/ewiki/nws.php?id=BQP+Web+Service

c. Running time prediction (Not yet)

After finishing those, I will discuss Yili to define interfaces to give those data.

Wednesday, February 21, 2007

Status Report for 02/14/07 to 02/21/07

1. Time series analysis graph
I have been working with drawing time series analysis graph by using BFO’s graphic library (http://big.faceless.org/). By using this java library, we can draw graphs with ease. Since the library can be used as a tag library, we can use this with JSP or JSF. Especially, with one of JSTL tag library, , BFO’s graph library can make a graph iteratively without explicit operation. The variable used in this case can be an array or list in the bean class. Another advantage of using BFO’s graphic library, we can make the graph interactive so that a user can click data inside the graph and verify its contents. For this purpose, we need to use both javascript and png graph format. As for the next step, I will put more interactive features to improve user interface in time series analysis portlet of QuakeSim2 project.

2. Workflow mapping in Grids
I’ve started to help Yili to implement workflow mapping scheme. My work is to supply information such as GPIR, Network Weather Service, running time prediction to a match maker which will construct an efficient DAGMan workflow based on the inputs. Currently I’m looking at what kind of interfaces will be used between the match maker and data suppliers

Thursday, February 15, 2007

Status Report for 02/08/07 to 02/14/07

1. Analyze-tseri web service
I have been working with building a web service to execute Time Series Analysis (analyze_tseri). A few bugs have been removed during the last week and now it works very well so far. Using the new web service, a user needs to send mainly parameters, in contrast to the previous case a user needs to generate a drive file to execute Time Series Analysis application (analyze_tseri_linux). A test client has been implemented and is running at http://gf1.ucs.indiana.edu:8888/STFILTER/EstimatedParams.jsf. A button “Run ST_FILTER_WS” will execute the analyze_tseri web service, while another button “Run ST_FILTER” still invokes the old method.
To refer to the definition of the service, a user can see the definition (WSDL) from here (http://gf1.ucs.indiana.edu:8888/analyze-tseri-exec/services/AnalyzeTseriExec)

As an output, the Time Series Analysis web service generates 3 picture files and returns the urls of the files so that a user can download the output from the server. A sample output is as follows:
http://gf1.ucs.indiana.edu:8888//analyze-tseri-exec/public_project-TEST/public_project-TEST.input.xyz.X.png http://gf1.ucs.indiana.edu:8888//analyze-tseri-exec/public_project-TEST/public_project-TEST.input.xyz.Y.png http://gf1.ucs.indiana.edu:8888//analyze-tseri-exec/public_project-TEST/public_project-TEST.input.xyz.Z.png

2. Paper submission to TeraGrid 07
Working with Mehment Nacar and Marlon, a paper for TeraGrid07 conference has been submitted. The paper mainly focuses on how OGCE and portlets was used to build Big Red portal to support customized application execution such as MEME command and showq command and how Grid Tags Libraries And Beans (GTLAB), developed by Mehmet Nacar, can be used for the best portlet production. A file is available to access at here (http://www.cs.indiana.edu/~jychoi/files/Teragrid_Big_Red_Portal-final.pdf)

Wednesday, February 07, 2007

Status Report for 02/01/07 to 02/07/07

I’ve just finished implementing a client (STFILTER) which will invoke time series analysis web service (AnalyzeTseriService). I added a web service version for time series analysis, called execATS. WSDL of execATS can be accessed at http://gf1.ucs.indiana.edu:8888/analyze-tseri-exec/services/AnalyzeTseriExec.

execATS needs the following 4 arguments as input:
  1. String siteCode – Site code such as dhlg
  2. String dataURL – Data file URL from which the server will download data file
  3. double[][] globalParam – Parameters for global station. Array of (double Parameter type, double param_1, … , double param_n)
  4. double[][] siteParam – Parameters for the specific station . Array of (double Parameter type, double param_1, … , double param_n)
A very simple example to create a client to invoke web service can be found at http://ws.apache.org/axis/java/user-guide.html#BasicsGettingStarted. In a nut shell, execATS web service can be executed from a client by using the following code:

String siteCode = "dhlg";
String dataUrl = "http://server:port/datafile";
double[][] globalParam = {
{ 7, 0.0, 50.0, 2005.0, 2008.0 },
{ 9, 0.0, 50.0, 2005.0, 2008.0 } };
double[][] siteParam = {
{ 8, 0.0, 50.0, 2005.0, 2008.0 } };

Service service = new Service();
Call call = (Call) service.createCall();

call.setTargetEndpointAddress(new java.net.URL(endpoint));
call.setOperationName(new QName("http://soapinterop.org/",
"execATS"));

String[] ret = (String[]) call.invoke(new Object[] {siteCode, dataUrl, globalParam, siteParam});

Wednesday, January 24, 2007

Status Report for 01/18/07 to 01/24/07

During the last week, I mainly focused on the following tasks:
1. Implementation of Time Series Analysis as a web service -- Most implementation is working now. I’m making the implementation to work as a web service.
  • To execute analyze_tseri_linux, we need to create a few input files. Among them, a parameter file needs more attention on creation. No blank line is allowed for separating sites. In the previous implementation, new line was added automatically, which caused error.
  • To server as a web service, type of inputs should be carefully considered. If a complex data type is used such as object, the data type should be serializable or mashalable.
2. Preparing to submit a paper to TeraGrid 07 about Big Red portal.
  • The paper will contain the experience of Big Red portal and portlet implementation for SC 06.
  • Grid Tag Library and Grid Beans made by Mehmet Nacar will be discussed too.

Wednesday, January 17, 2007

Status Report for 01/11/07 to 01/17/07

I’m working on QuakeSim2 project by implementing a web service for Time Series Analysis. Currently deployed Time Series Analysis service needs to be improved for providing better user interfaces. For this purpose some functionality in the old implementation should be moved into a new service implementation. The following works should be done:
  1. Implementing a stand-alone Time Series Analysis application. The new application will generate drive files for given user input and execute analyze_tseri_linux utility. (will be finished at the end of this week)
  2. Converting the application into a web service application.

After finishing this implementation, I will help out to develop another module in QuakeSim2 project and start with Polar Grid project.

Wednesday, December 27, 2006

Status Report for 12/21/06 to 12/27/06

I've installed CEMon Client APIs in my local machine. The following is my summary of CEMon Client API installation.
1. Download the most recent files from http://grid.pd.infn.it/cemon/ClientRPMs
2. Install RPMs as follow:
rpm -ivh c-ares-1.3.0-1.slc3.i686.rpm
rpm -ivh glite-security-gsoap-plugin-1.4.0-0_U200612071426.i386.rpm
rpm -ivh gpt-VDT1.2.2rh9-1.i386.rpm
rpm -ivh glite-security-gsoap-plugin-1.4.0-0_U200612071426.i386.rpm
rpm -ivh glite-ce-monitor-client-api-c-1.7.5-0_U200612071517.i386.rpm
3. Set up library path:
export LD_LIBRARY_PATH=$LD_LIBRARY_PATH:/opt/glite/lib:/opt/globus/lib:/opt/c-ares/lib
4. Testing
cd /opt/glite/bin
CEMonitorGetInfo

Although I haven't completed verifying that CEMon Client APIs are working in my environments, I'm looking at how CEMon is working in client side.

Wednesday, December 20, 2006

Status Report for 12/13/06 to 12/20/06

Basically CEMon is used to provide/get information for helping resource selection. The service consists of two parts: a CEMon server and a client. While the CEMon server produces information and publishes to its subscribers, the CEMon client consumes the events. CEMon is based on a web service providing WSDL and SOAP message is needed for subscription.

To implement CEMon as a web client using OGCE, I need to do the followings:
  1. Install CEMon command line tools and try to use them to know how CEMon service is working
  2. Analyze CEMon’s WSDL to find commands between CEMon server and clients
  3. Implement CEMon web client by using Java

Now I’m ready to submit a job to OSG since I got a valid certificate and registered a member of OSG VO. For the next week, I will complete step 1.

Wednesday, December 13, 2006

Status Report for 12/06/06 to 12/12/06

Currently I’m playing around OSG and reading some documents about CEMon. Especially, I found that the following website is useful: http://vdt.cs.wisc.edu/components/cemon.html. After understanding CEMon, I’m planning to build a dashboard portlet which can work with CEMon.

Wednesday, November 29, 2006

Status Report for 11/22/06 to 11/28/06

1. OGCE portlets
I’m still updating source codes of MEME portlets and Jobqueue portlets by adding comments and removing debugging messages. The source codes and war files will be exported to the SourceForge repository. The following portlets will be added:
a. memejob-portlet : A portlet for MEME job execution
b. moab-dashboard : A portlet for job queue status query
c. serialjob-portlet : A general portlet to execute a series of jobs

2. Open Science Grid
Meanwhile waiting for a user certificate from OSG CA, I’m working on setting up OSG client in my local machine. I think my installation was successful but $VDT_LOCATION/post-install/README reports a few warnings I should fix. I will clear up those as soon as possible and start to look at OGCE in OSG and CEMon.

Wednesday, November 22, 2006

Status Report for 11/15/06 to 11/21/06

1. Open Science Grid
After coming back Supercomputing '06 at Tampa, I'm looking around Open Science Grid (OSG) to verify whether OGCE portal can also work with OSG environments. For this test, I’ve installed OSG client by following the client installation instructions and been trying to setup correct configuration which includes certificates for GSI settings.

2. OGCE portlets
I’m preparing to export source codes of MEME and job queue portlets to CVS repository by adding comments into the codes and removing verbose debugging messages.

Wednesday, November 08, 2006

Status Report for 11/1/06 to 11/7/06

During the last week, I was working on Big Red portal by customizing for Supercomputing 06 and updating key portlets such as MEME job submission portlet and MOAB job queue portlets. Major works on portlets are as follows

1. MEME job submission portlet
a. File downloading: Basically, in portlets, file downloading feature is not working well since html header cannot be set by portlets but, instead, portlet container usually control html header such as "Content type" or "Content-Disposition". Thus, using servlet than portlet is more ideal in this situation. Good news here is that servlet and portlet can share data by using session. Thus, I created a servlet for file downloading which can get proxy information for authorization by using shared session.
b. Output retrieval: Outputs executed by a job managers can be retrieved later by using job handler which is an URL string starting with "http" or "https". Under the hood of this function, GASS server is in charge to save data and hand it over to the client upon request.

2. MOAB job queue viewer

a. Job query belongs to the user: Since each machine in Teragrid has different user map file on user certificate, username(id) can be different system by system even in using the same certificate. Simply, we can submit a GRAM job before starting query to get back a correct username by executing “whoami” command. Later, I’m planning to maintain information service to map usernames on different machines file by using RDF and Jena from HP labs.

Tuesday, October 31, 2006

Status Report for 10/25/06 to 10/31/06

1. Introduction - A Big Red portal development project
The mission is to create portlets for Big Red portal which will be open to the public for those who want to use newly installed supercomputer in IU, Big Red. Most of portlets come directly from OGCE Grid portlets and a few portlets should be created to deal with Big Red's special needs. Currently the following portles are under development:
a. MEME job submission portlet : a portlet to execute a remote MEME command
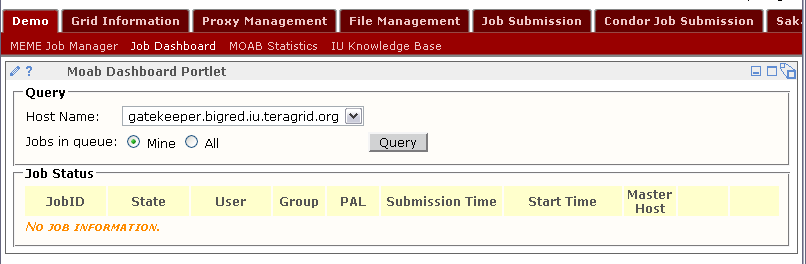
b. Job status dashboard : a portlet to query job queues managed by MOAB job queue manager
c. IFrame for IU's Knowledge Base : a iframe portlet displaying IU's Knowlege Base webpages.

2. Week activity (10/25 ~ 10/31)
a. Datafile uploading in MEME portlet
-. Datafile uploading function is done.
-. Output downloading will be implemented soon

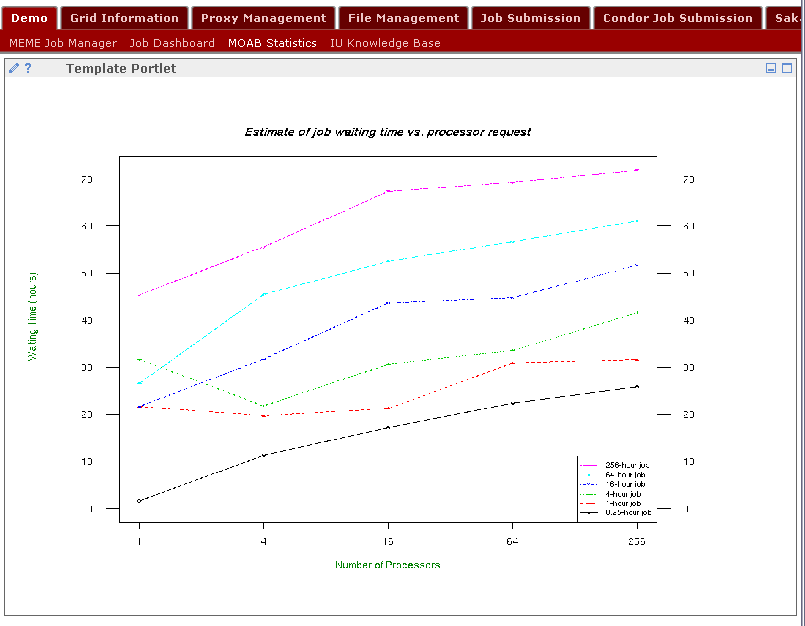
b. Job queue forecast image portlet

-. A fixed image can be refreshed continually in a specific interval (60 seconds or so).

c. MOAB dashboard

-. A radio button is added to specify a query condition. It can show all jobs or only user's jobs.


3. Next activity
a. Downloading functionality will be implemented in MEME job submission portlet. Then, users can download output directly from the same portlet
b. Job submission portlet enhancement : Adding a "Serial Job" and a "Parallel Job" portlet. A portlet will rather be more general in a way the portlet can be included in OGCE.